
2026 Housing and Outlook
Wisconsin housing market stabilizes with continued improvement expected in 2026
Dave Clark, Professor Emeritus of Economics at Marquette University and Principal at Econ Analytics LLC

At the beginning of 2025, there was considerable uncertainty as to the direction of the national economy and the housing market. A new administration had taken control in Washington with the president promising radical change to the status quo, which always leads to some level of uncertainty in the country. And while the political climate remains tumultuous, economic conditions have stabilized nationally with strong economic growth and continued moderation in the national rate of inflation. Indeed, it appears that the Federal Reserve has made significant progress taming inflationary pressures without precipitating a recession. However, this so-called “soft landing” has not resulted in significant growth in the state housing market, primarily because there remains relatively strong demand for housing but very limited supply of single-family homes.
This gap has constrained sales and driven up home prices, a pattern that creates affordability challenges, especially for millennials who have yet to buy their first homes. In this article, we will review the condition of the national and state economies and then consider how those economic trends have impacted the Wisconsin housing market in the past year. We will then evaluate the expected impact of those economic trends on the existing home market in 2026 and beyond.
State of the economy
Real GDP growth and the labor market
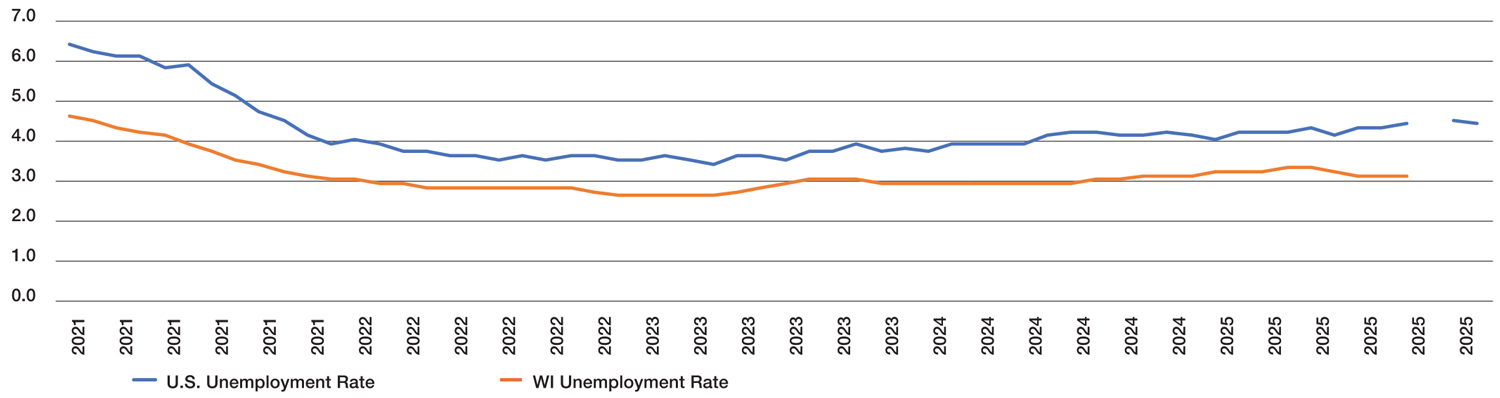
The U.S. economy began 2025 with a slight decline, as Real Gross Domestic Product (RGDP) fell 0.6% in the first quarter. However, this was an anomaly driven by a surge of imports by U.S. firms attempting to insulate themselves from the consequences of a new tariff regime by the incoming administration. In contrast, the next two quarters saw robust growth with RGDP rising 3.8% in Q2 and 4.3% in Q3. Although national employment growth has been modest at best in the second half of 2025, the U.S. unemployment rate remained in the range of 4.3% to 4.5% throughout that period, which is near the level economists classify as full employment. Moreover, as shown in Figure 1, the Wisconsin unemployment rate continues to track below the national rate, with rates in the 3.1% to 3.3% range between January and November 2025. All these figures suggest the labor market remained healthy and the economy continued to expand in 2025.
Figure 1: Unemployment Rate (Seasonably Adjusted)
Source: U.S. Bureau of Labor Statistics
Note: The federal government shutdown resulted in a gap in unemployment data with no data reported in October 2025.
Progress on inflationary expectation
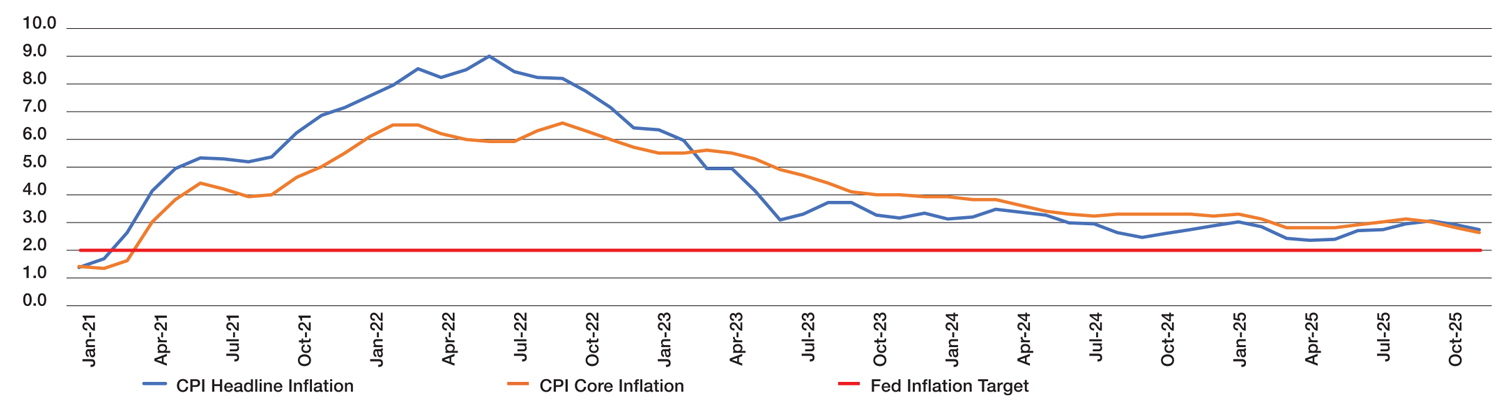
The Federal Reserve Bank has a dual mandate of conducting monetary policy to avoid recessions while also maintaining stable prices. Price stability is defined as an inflation rate of 2%. The federal government developed a variety of inflation measures that essentially measure the percentage rate at which a market basket of goods changes over time. Headline inflation includes a wide range of goods and services, including two sectors of goods — food and energy — that are quite volatile on a month-to-month basis. Instead of using headline inflation, the Fed omits these volatile sectors and instead focuses on the so-called “core inflation” rate, which is thought to better reflect long-term inflationary expectations. Both headline and core inflation rose in the aftermath of the pandemic, with headline inflation peaking at 9.1% in June 2022, and core inflation topping out at 6.6% in September 2022. The good news is that we have made progress on both measures of inflation over the last 2.5 years. Specifically, in November 2025, core inflation dropped to 2.6%, and this downward trend should lower expectations regarding future inflation.
Figure 2: U.S. Inflation Rate Measures
Source: U.S. Bureau of the Census
Mortgage rate trends
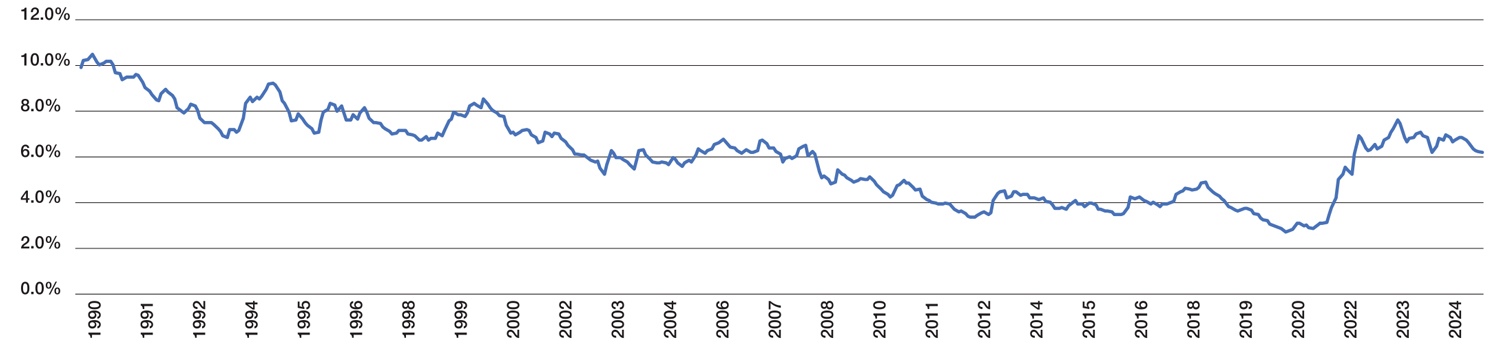
Lower inflationary expectations have contributed to a reduction in the 30-year fixed-rate mortgage. As seen in Figure 3, the rate fell from an average of 6.96% in January 2025 to just 6.19% in December 2025, which represents a solid improvement in just one year. And while current rates are more than twice the average rate of 2.68% for December 2020, they are below the recent peak rate of 7.62% in October 2023 and much lower than the 10.48% rate recorded in May 1990.
Figure 3: 30-year Fixed Mortgage Rate
Source: Freddie Mac
Overview of Wisconsin housing market trends
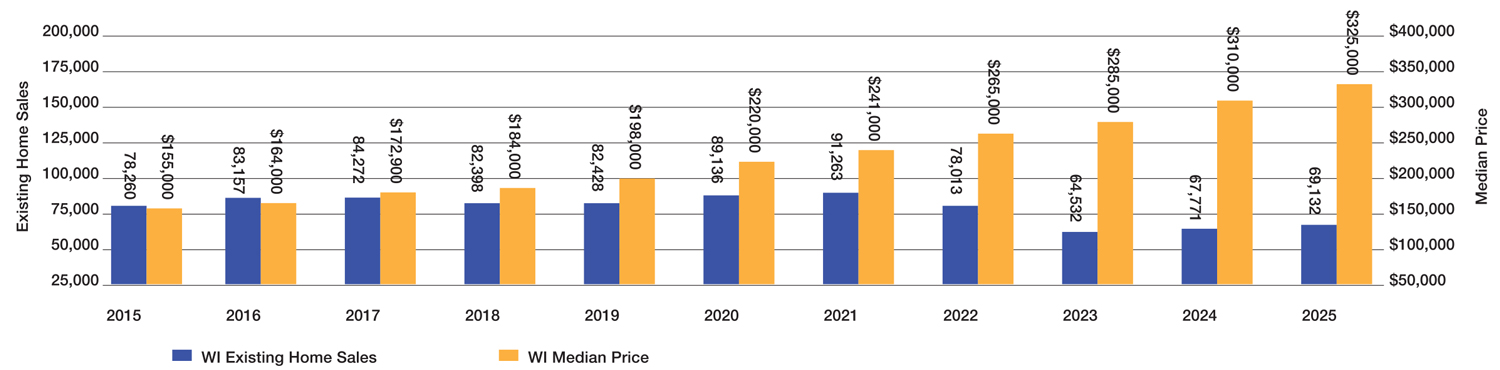
Figure 4 gives an overview of annual single-family existing home sales and median price data since 2015. A review of the data reveals some interesting trends. On the sales front, home sales between 2016 and 2019 were relatively flat, followed by relatively strong sales in 2020 and 2021 before a significant decline in sales between 2021 and 2023 and flat sales thereafter. In contrast, median prices rose throughout the 2015-2025 period, with prices more than doubling in 11 years.
Figure 4: Wisconsin Home Sales and Median Prices
Source: Wisconsin REALTORS® Association
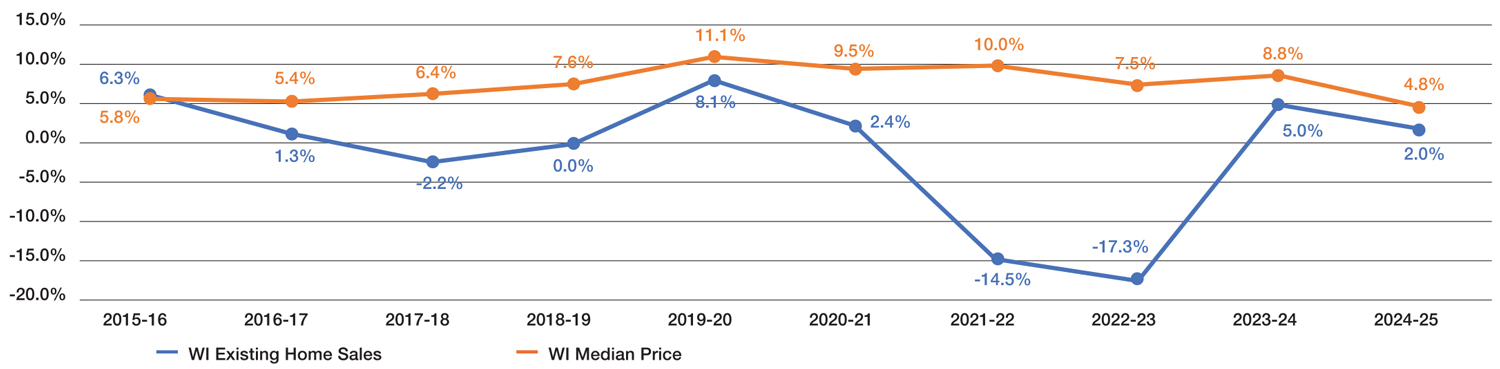
Figure 5 gives a more detailed picture of the year-to-year changes in the growth of sales and median prices. The annual growth in existing home sales has seen growth and decline over the period, with sales growth peaking in the 2019-20 period, followed by a sharp contraction over the next two years and a modest recovery thereafter. On the other hand, prices rose consistently, with the strongest annual appreciation rates recorded between 2019-20 and 2023-24.
Figure 5: Growth Rates for Home Sales and Median Prices
Source: Wisconsin REALTORS® Association
Underlying factors influencing housing market outcomes
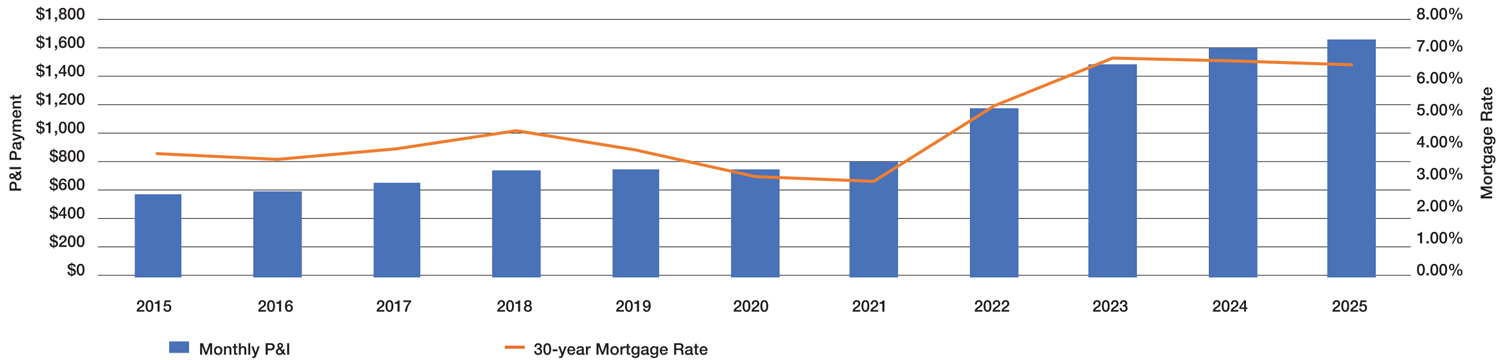
The economics behind these trends focuses on factors affecting the supply and demand for single-family homes. As we will see, three factors are prominent drivers of these trends, including mortgage rates, inventories and demographics of homeownership. First, let’s consider the role of mortgage rates, which impact both the demand and the supply of single-family home sales. On the demand side, the issue is clear: Lower mortgage rates translate into lower monthly payments for buyers. In Figure 6, we compute the monthly payment of principal plus interest for a buyer purchasing the median-priced home assuming a 20% down payment with the remainder of the balance financed with a 30-year fixed mortgage at the average annual rate for the year. The principal plus interest payment increased from $581 in 2014 to $1,659 in 2025. The significant increase in these payments beginning in 2022 is driven by the increases in mortgage rates as well as median prices.
Figure 6: Monthly P&I Payments for Wisconsin Median-prices Home vs. Average Annual Mortgage Rate
Source: P&I data derived from Fannie Mae; 30-year mortgage rate data derived from Freddie Mac
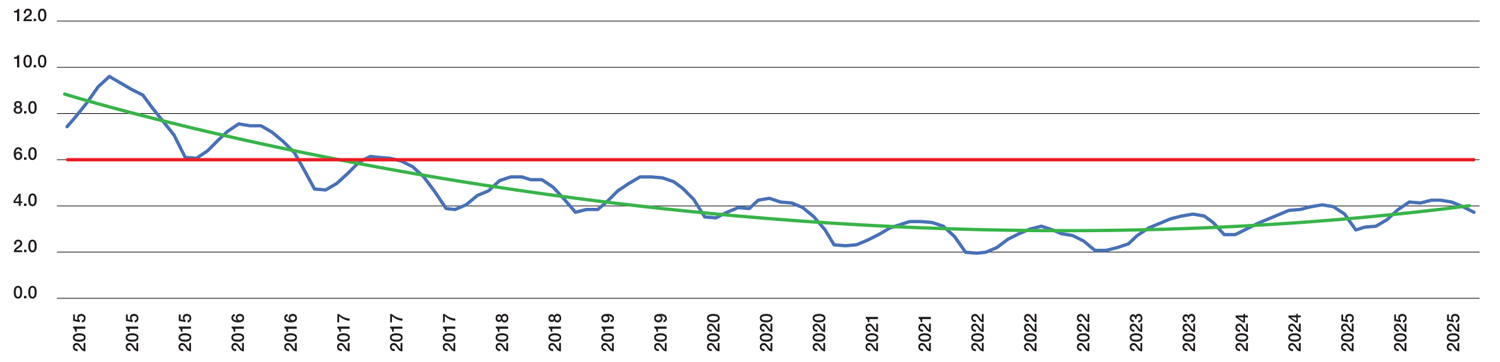
However, mortgage rates also affect the supply side of the existing home market as those homeowners who refinanced their homes during periods of very low mortgage rates are reluctant to give up those favorable rates to buy another property. This so-called “mortgage rate trap” has placed severe constraints on inventories. Housing analysts generally consider a market balanced when there are six months of supply available. Supply below that level is considered a seller’s market, while supply above favors buyers.
As Figure 7 shows, months of supply follow a regular seasonal pattern, falling during winter months and peaking in the summer. It also shows that Wisconsin has been in a seller’s market since the summer of 2017, and months of inventory fell to just 1.9 months of supply in January 2022. Since that time, available supply has begun to drift upward as the green trendline in Figure 7 shows.
Figure 7: Months of Available Supply in Wisconsin
Source: Wisconsin REALTORS® Association
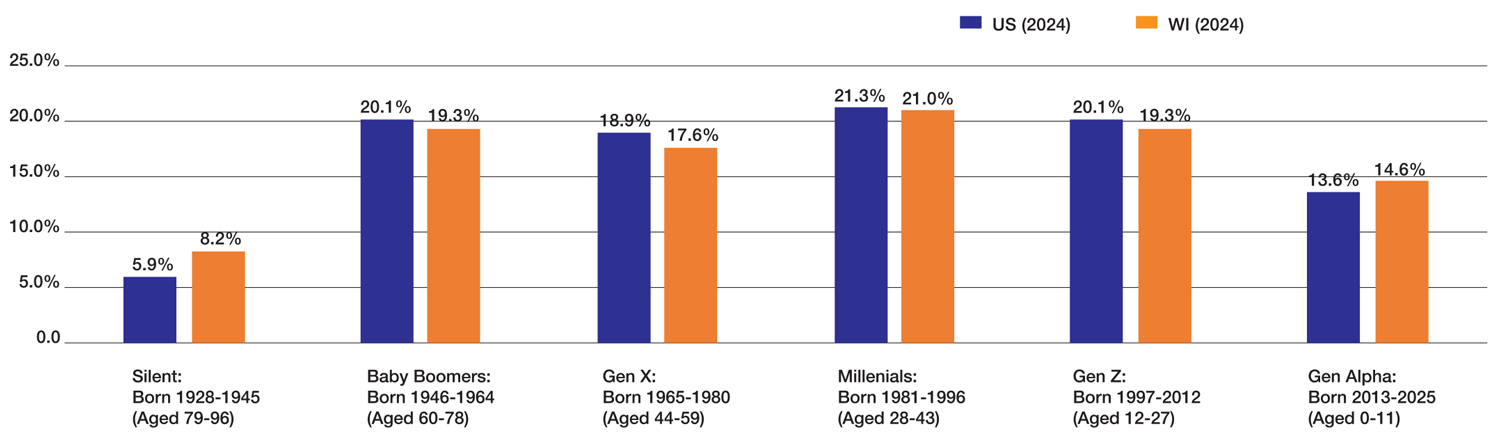
Demographics also play a large role in the housing market, especially over longer periods of time. An overview of the current distribution of the population across the various age cohorts is shown in Figure 8. As we will see, evolving trends in these population groups also influence both the demand and supply sides of the existing home market. Based on national population figures shown in Figure 8, the millennial generation is now the largest population cohort, accounting for just over 21% of the U.S. population. This is followed by the baby boomer and Gen Z population cohorts. These patterns are similar for Wisconsin.
Figure 8: Generational Shares of 2024 Population
Source: Derived from U.S. Census Bureau data
To better understand buying and selling patterns across demographic groups, we turn to the National Association of REALTORS® (NAR) annual survey of recent homebuyers and sellers. The 2025 Home Buyers and Sellers Generational Trends report, based on transactions from July 2023 to June 2024, found that millennials were not the largest share of buyers. Specifically, millennials purchased just 29% of homes in their sample, whereas baby boomers bought 42% of the homes, and Gen X buyers accounted for 24% of buyers. Not surprisingly, a very small share of homes at 4% were purchased by the Silent Generation. While millennials were well behind boomers in terms of all purchases, those who did buy homes were often first-time buyers. Specifically, 71% of young millennial buyers between 26 and 34 years old were first-time buyers, and 36% of older millennials between 35 and 44 years old were buying for the first time. Since first-time buyers rely more heavily on financing, mortgage rates have a more significant impact on those buyers than buyers who have accumulated equity in a previous home.
On the seller side, millennials accounted for 19% of those selling homes, whereas baby boomers accounted for 53% of homes sold, Gen X households accounted for 22% of homes sold, and the Silent Generation were 5% of total sellers. Although the population totals for boomers and those in the Gen X cohorts are similar, their likelihood of selling is much different.
Predictions for the future
This has been a tough housing market over the last several years, with weak supply and tight inventories limiting buying opportunities even as relatively high prices and mortgage rates have reduced affordability. Still, there are reasons to be cautiously optimistic about the future. We focus first on near-term predictions and then discuss long-term projections.
If trends that evolved in 2025 continue into 2026, we should see more improvements in housing affordability. First, there has been solid overall economic growth as reflected in RGDP statistics in the second and third quarters of 2025, and preliminary projections of Q4 2025 growth are promising. In addition, the Philadelphia Federal Reserve Bank’s latest Survey of Professional Forecasters predicts positive RGDP growth through the end of 2026. A growing economy should keep income levels growing as well. Second, we have seen a reduction in core inflation during the second half of 2025, and that has likely helped to reduce mortgage rates. A continuation of that trend could potentially push rates below 6% in 2026. Finally, the rate of housing price appreciation moderated to 4.8% in 2025, which is the lowest rate in the last 11 years. Overall, rising income, moderating mortgage rates and slower price appreciation all improve affordability, which is important for buyers, especially those buying their first homes.
Longer term, the aging of the generations that preceded the millennial generation should help to move the market closer to a balanced market. The oldest baby boomers turn 80 in 2026, and while advances in health care have allowed this generation to remain in single-family homes longer than their predecessors, changes in life circumstances will open new inventory for the generations that follow. In addition, we hope that ongoing efforts by the Fed to further reduce inflationary expectations while maintaining full employment will keep income growing while simultaneously reducing mortgage rates.


